Workspace
Workspace overview
في هذه الصفحة
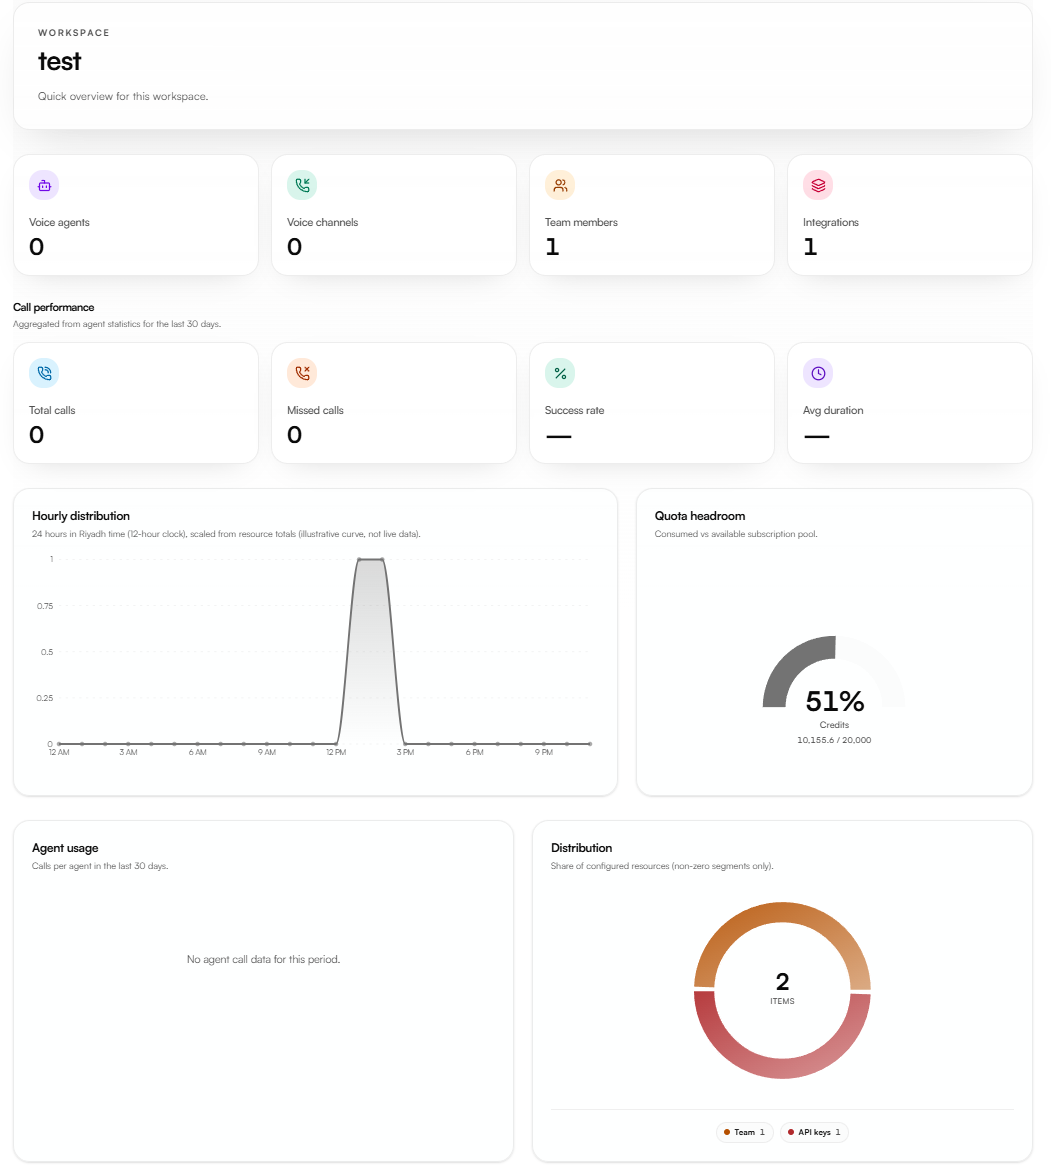
The Workspace Overview is the first page you see when you open Nabrah Agents. It gives you an at-a-glance summary of your entire workspace how many agents you have running, your active voice channels, your team, and your call performance over the last 30 days.
Workspace summary
Four cards appear at the top of the page. Each one shows the current count for a key resource in your workspace.
Card | What It Shows |
|---|---|
Voice agents | Total number of agents configured in this workspace |
Voice channels | Total number of active voice channels connected |
Team members | Total number of users with access to this workspace |
Integrations | Total number of active third-party integrations |

Call performance
The Call Performance section shows aggregated statistics from all agents in your workspace over the last 30 days. It updates automatically as new calls come in.
Metric | What It Measures |
|---|---|
Total calls | The total number of calls handled across all agents |
Missed calls | Calls that were not answered or failed to connect |
Success rate | The percentage of calls that reached a successful outcome |
Avg duration | The average length of a completed call in minutes and seconds |

Hourly distribution
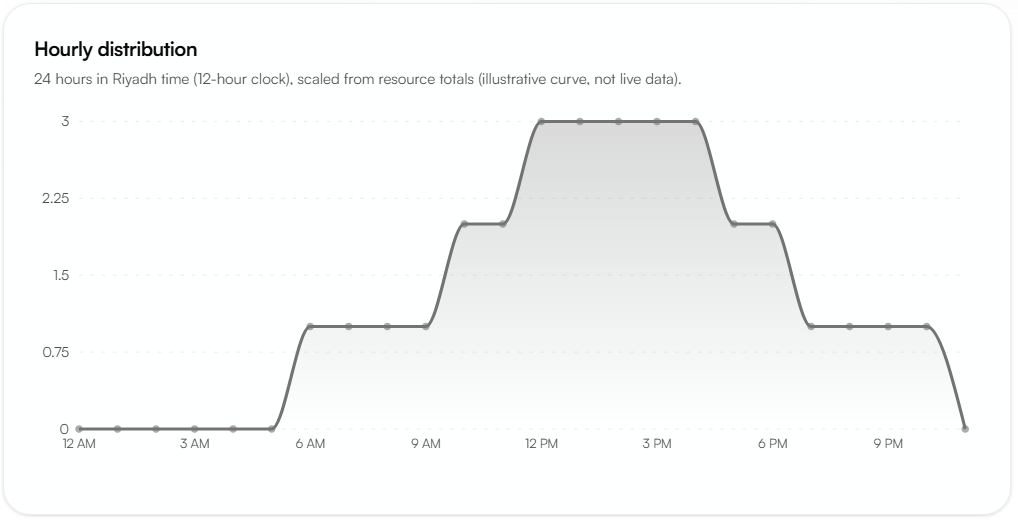
The Hourly Distribution chart shows your call volume pattern across a 24-hour period in Riyadh time. Use this chart to understand when your agents are busiest and plan your capacity accordingly.
Note: The chart is scaled from your resource totals and shows the shape of your call pattern. It is not a live, minute-by-minute feed.
Quota headroom
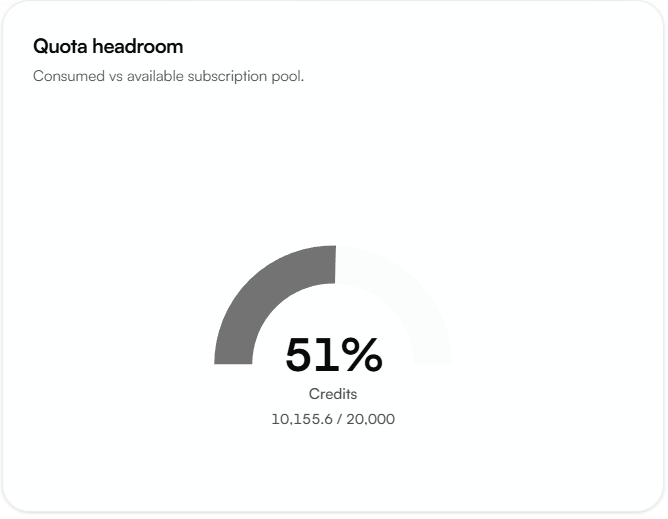
The Quota Headroom section shows how much of your monthly credit balance has been consumed versus how much remains. Monitor this regularly to avoid service interruption.
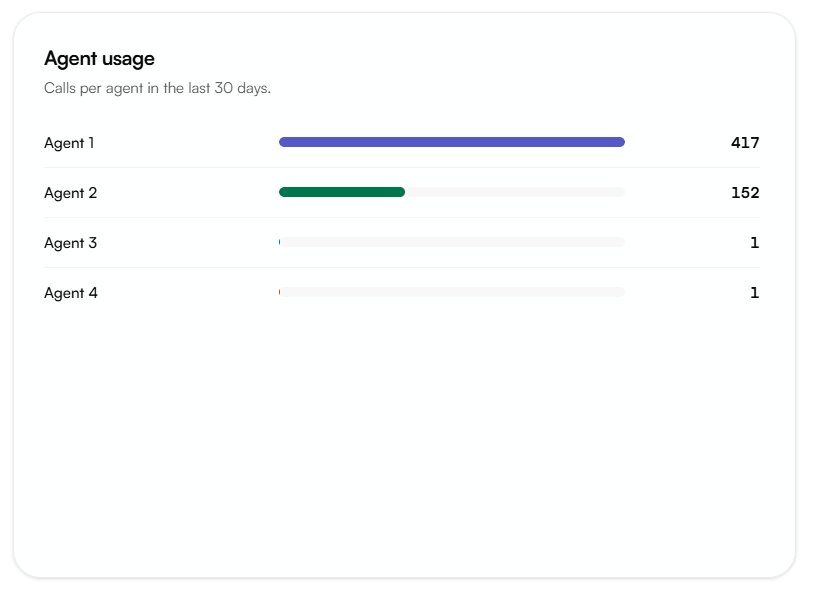
Agent usage
The Agent Usage chart lists every agent in your workspace by its call volume over the last 30 days, from highest to lowest. A horizontal bar and exact call count appear next to each agent name.
Use this chart to identify your most active agents and spot any agents that are receiving little to no traffic.
Distribution
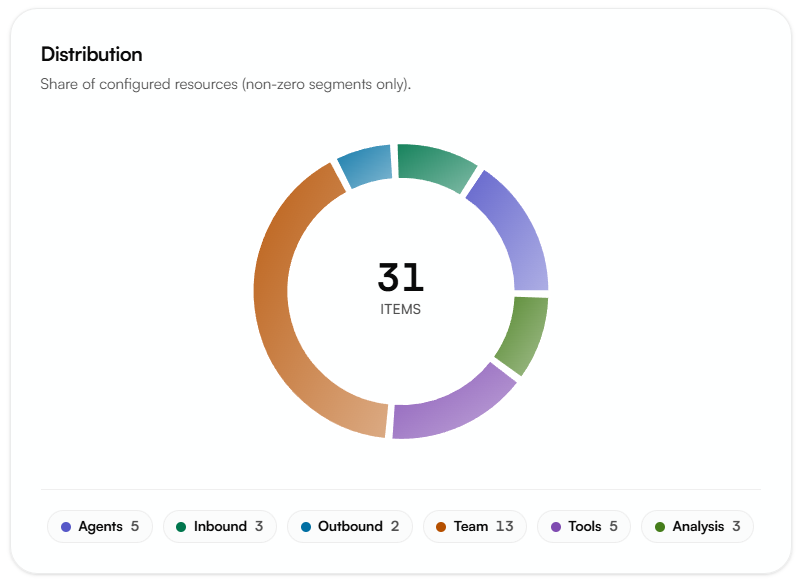
The Distribution chart shows the share of configured resources across your workspace as a donut chart. The total number of items appears in the center.
Resource | What It Counts |
|---|---|
Agents | Total configured agents in the workspace |
Inbound | Total inbound services connected |
Outbound | Total outbound services configured |
Team | Total team members with workspace access |
Tools | Total custom tools created |
Analysis | Total analysis groups defined |
Use this chart to get a quick overview of how your workspace resources are structured.