Workspace
Calls analytics
On this page
Calls Analytics gives you a detailed view of your agents' call performance over time. Use it to track volume trends, measure outcomes, and review AI-generated insights across all agents or a specific one.
Filters
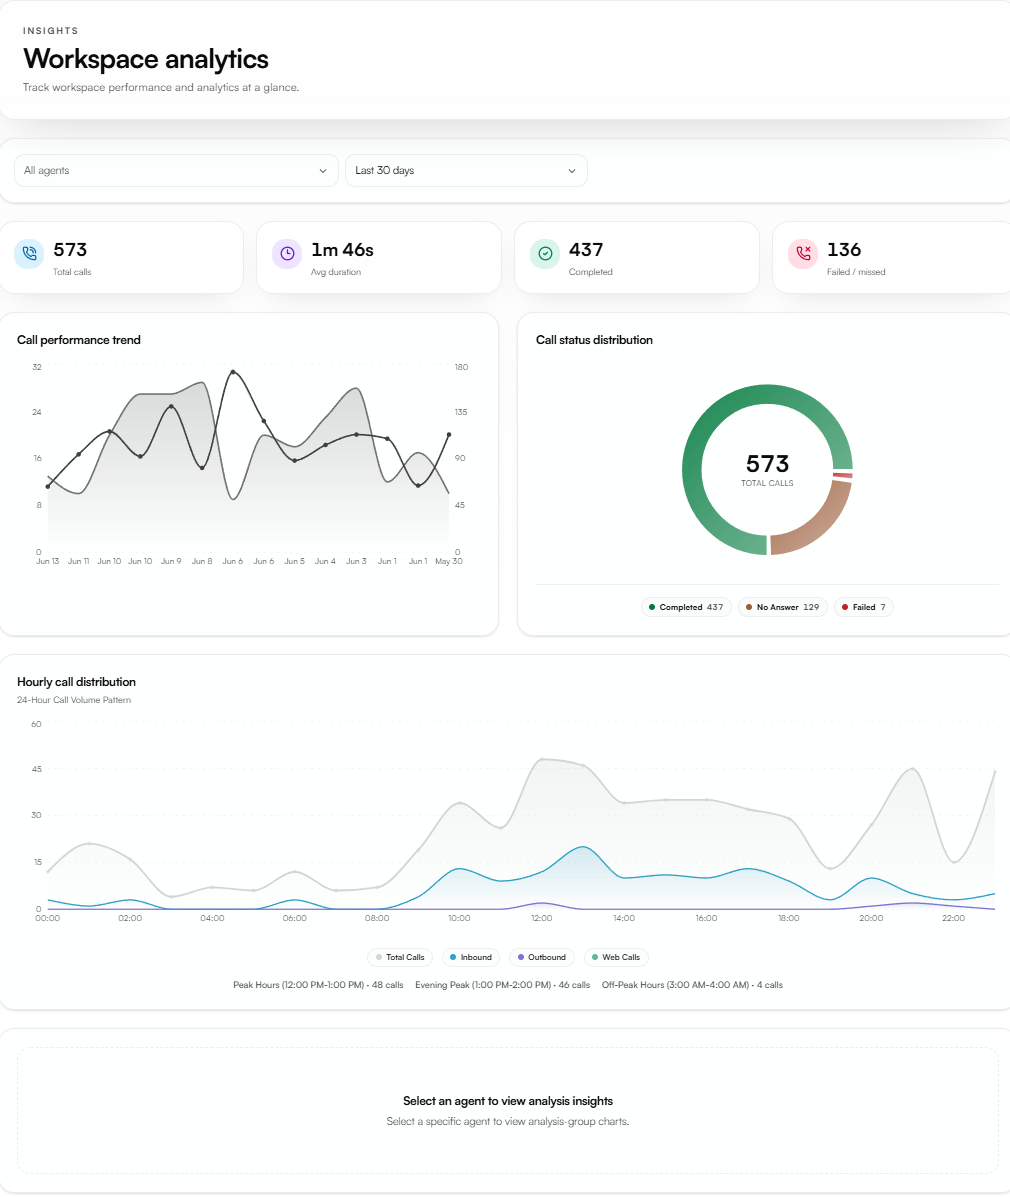
Two filters at the top of the page control what data is displayed.
Agent filter : select a specific agent or view data across all agents in your workspace.
Time period filter : select the date range for the data, such as the last 7 days or last 30 days.
All metrics and charts update immediately when you change a filter.
Metrics
Four metrics appear at the top of the page. They reflect the totals for the selected agent and time period.
Metric | What It Measures |
|---|---|
Total Calls | The total number of calls handled in the selected period |
Avg Duration | The average call length across all calls in the selected period |
Completed | The number of calls that reached a successful end |
Failed / Missed | The number of calls that were not answered or ended in an error |

Charts
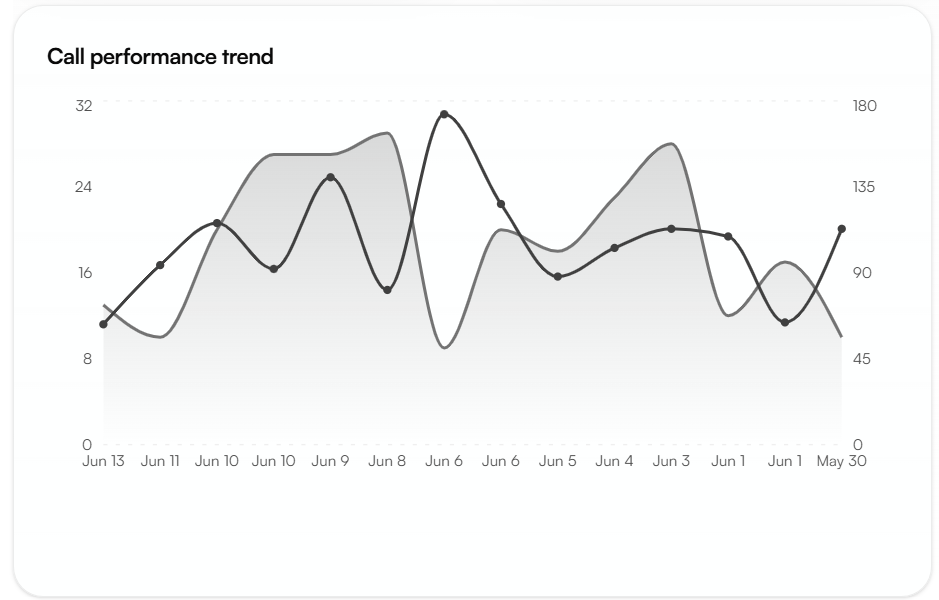
Call performance trend
A line chart showing how your total call volume changes day by day over the selected time period. Use this to spot peaks, drops, and activity patterns across your agents.
Call status distribution
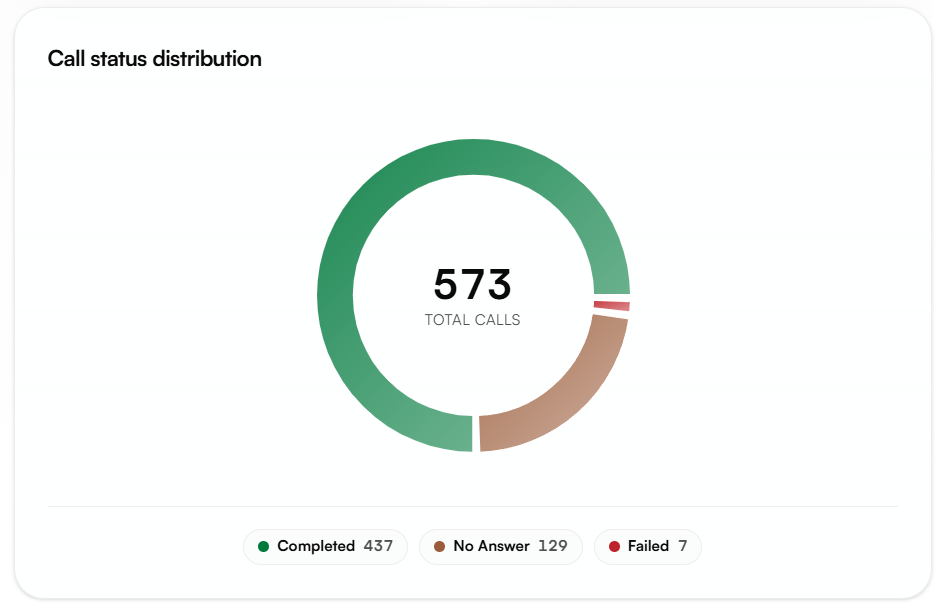
A donut chart showing the breakdown of all call outcomes for the selected period.
Status | What It Means |
|---|---|
Completed | Calls that reached a successful end |
No Answer | Calls where the agent received no response from the caller |
Failed | Calls that ended due to a technical or connection error |
Hourly call distribution
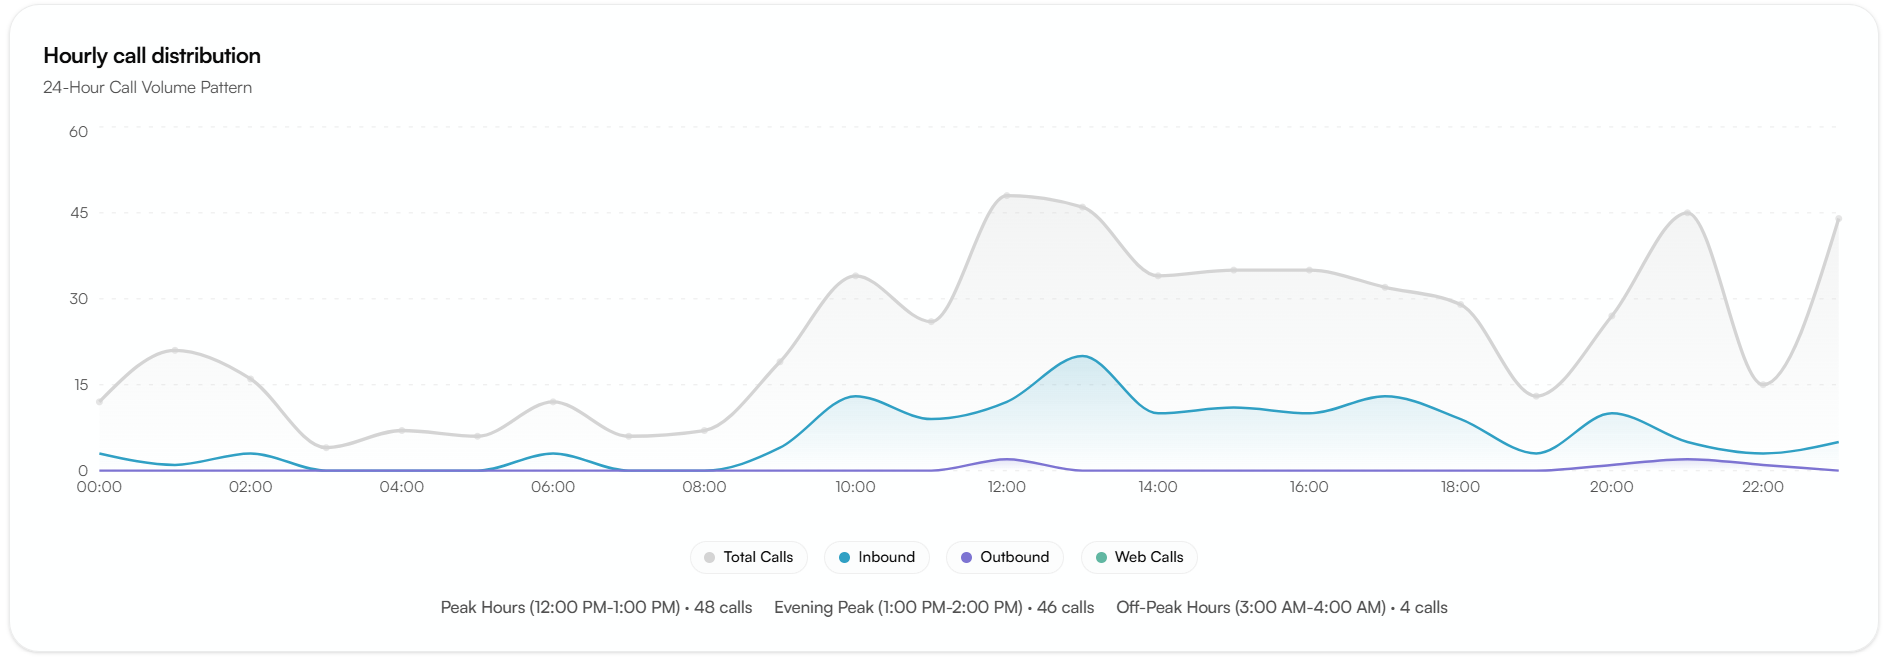
A 24-hour area chart showing when your calls are concentrated throughout the day. Four call types are plotted separately:
Total calls : the combined volume across all types
Inbound : calls received through your inbound services
Outbound : calls initiated through your outbound services
Web calls : calls initiated through the web-call widget
The chart also highlights three time periods automatically:
Peak hours the busiest hour of the day with the highest call volume
Evening peak the second concentration of activity
Off-peak hours the quietest period with minimal call activity
Use this chart to understand when your agents are busiest and plan capacity accordingly.
Agent analysis insights
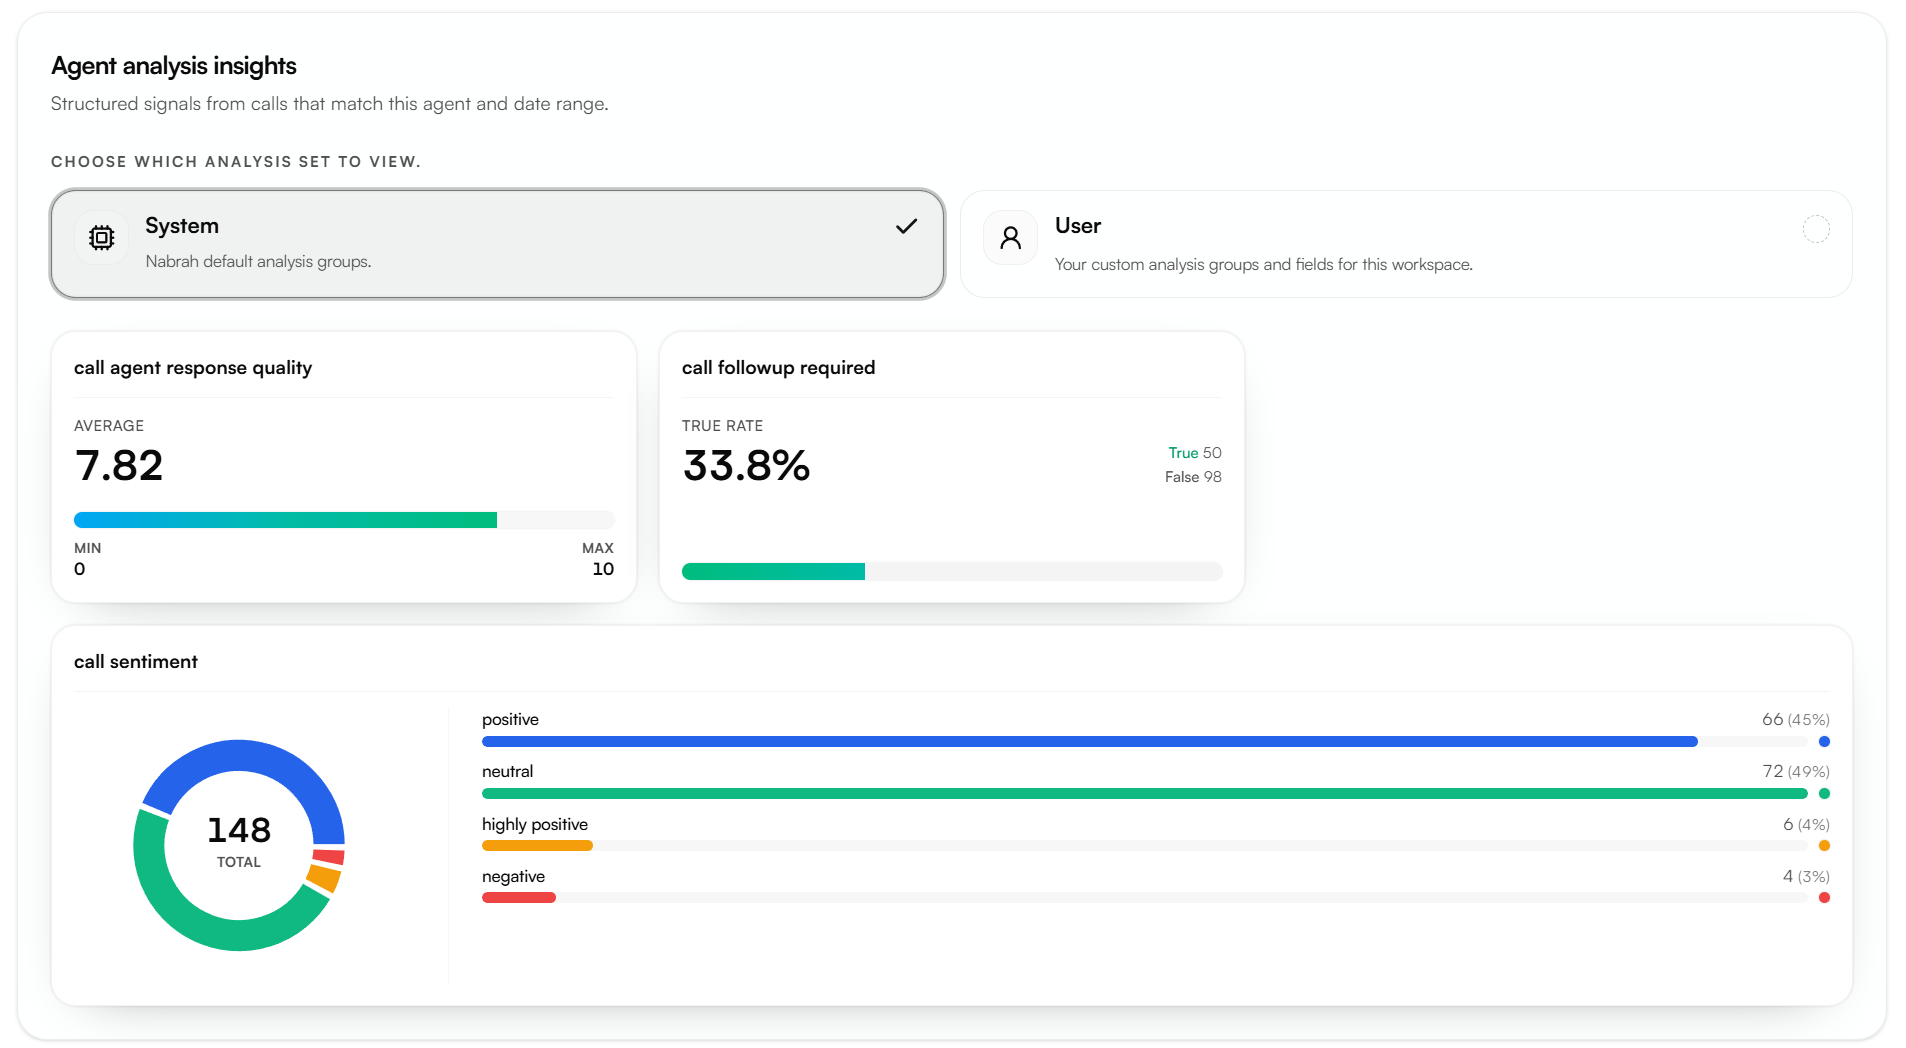
The Agent Analysis Insights section appears below the charts when a specific agent is selected. It provides structured AI-generated signals from every call that matches the selected agent and date range.
Two tabs are available:
System
The System tab shows Nabrah's default analysis metrics, applied automatically to every call.
Call Agent response quality : an average score from 0 to 10 measuring how well the agent adhered to its defined prompt and operational guidelines across all calls in the selected period.
Call follow-up required : the percentage of calls where the AI determined that further manual intervention was needed. Displays both the true rate (follow-up required) and false rate (resolved during the call).
Call sentiment : a donut chart breaking down the emotional tone detected across all calls.
Sentiment | What It Indicates |
|---|---|
Highly Positive | Caller expressed strong enthusiasm or appreciation |
Positive | Caller expressed satisfaction or agreement |
Neutral | Caller showed no strong emotional signal |
Negative | Caller expressed dissatisfaction or frustration |
Highly Negative | Caller expressed strong frustration or hostility |
User
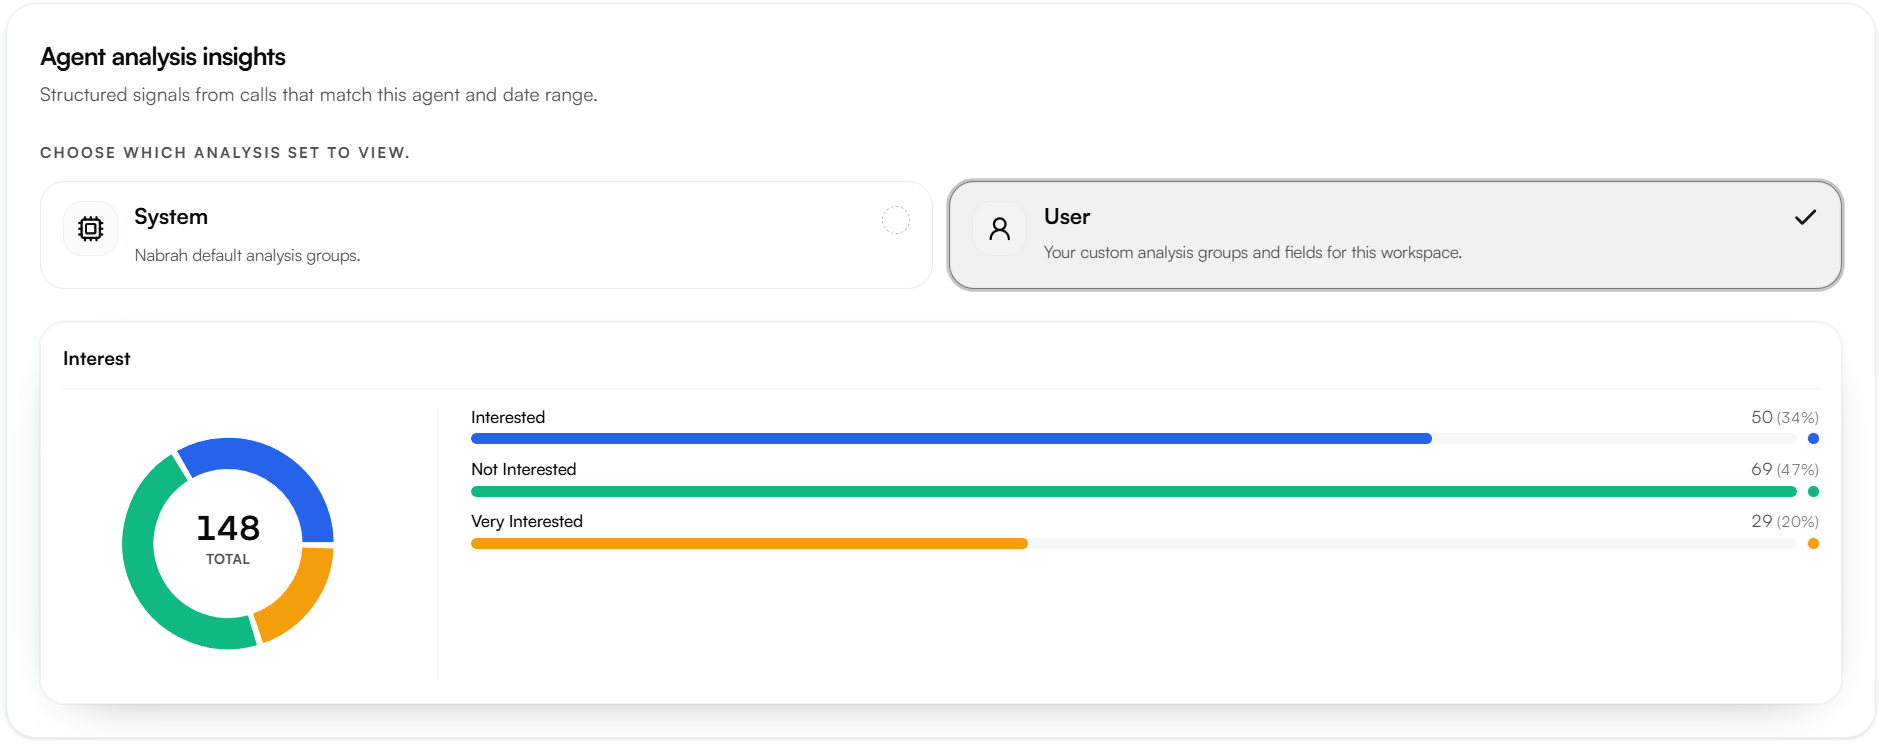
The User tab shows your custom analysis group data. If you have linked an Analysis Group to the selected agent, the structured data points extracted from calls appear here as charts and distributions.
The fields and categories shown depend entirely on how you configured your Analysis Group. For example, if your group tracks customer interest level, you see a breakdown of Interested, Not Interested, and Very Interested responses across all calls.
Tip: To start seeing data in the User tab, link an Analysis Group to this agent under Build → Agents → Tools & Analysis. See Analysis Groups for setup instructions.